
Introduction to EasyView – a brief getting started guide
Get Started with Tinytag in EasyView 11
Connect your Tinytag to the computer. If your computer doesn’t detect the logger, you may need to install drivers. Then click on the Tinytag icon.

A page will open where you can see which COM ports are available on your computer. Even if you are using a USB cable, it creates a COM port. The software should now automatically detect your connected logger.
At the top right of the page, you will see the current settings for the logger. The title is adjustable here if you want the next recording to be named something else.
 If you want to change the settings for the logger, click "Change settings" at the bottom of the page. If "Offline" is active, it shows that you are changing the settings for an offline recording.
Under start options, choose when or how you want your logger to start. We recommend always selecting start as soon as possible.
However, it is possible to select a specific date and time to start. This option should not be used if the logger is to start within ten minutes. If you have a magnet, you can choose "Magnet start." In this case, the logger will only start when you place the magnet against it.
On the right side of the dialog box, you can select which values to save, usually only normal values.
For intervals longer than one minute, you can choose to save min and max values. This will store the lowest and highest values within the interval. With min/max, the logger reads the values every minute and then records the highest/lowest value during the interval. Normal value is an instantaneous value, meaning the value measured at the end of the interval. Here you can also set the sampling interval.
Here you decide how the memory will be allocated.

You can choose to stop recording after a certain number of readings. It is also possible to have rolling memory. In this case, the oldest values will be overwritten when the memory is full. The most common option is to stop recording when the memory is full.
Under alarms, you can set any alarm thresholds. Choose whether the logger should alarm above or below a certain level.

You can also choose to have locked alarms. This means that the LED indicating the alarm will continue to do so even when the logger is no longer above or below the set alarm threshold. Note that if you have programmed "locked alarm under" and start the logger in an "alarm area," for example, -5°C when the alarm threshold is -2°C, the logger will not alarm until it goes above -2°C and then drops below again.
When all settings are complete, click start. The status of your logger will then show "Slow recording" if you selected start immediately, or "Waiting" if you chose delayed start. The symbol at the bottom right will show a red stoplight.
You can now safely disconnect the logger. When you reconnect the logger after the measurement is complete, select to stop the measurement by clicking the symbol with the red stoplight. Then click "Download data." It is also possible to download data without stopping the logger.
Navigate the menus in EasyView 10
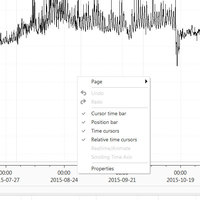
By right-clicking in different parts of EasyView, you can access various menus. Here's a quick overview to help you navigate.


